Graph the result of an array containing the data
Get the data from an array, a CSV, a JSON and draw it !
$graph = new Domframework\Graph ();
// For CSV:
$graph->data->csv ("\"\",Jan,Feb,Mar,Apr,May\n".
                 "Prod,200,210,NO,230,240\n".
                 "Return,5,4,3,2,1");
// For JSON:
$graph->data->json (json_encode (array (array ("T1","1","2","3","4"),
                                        array ("T2","5","6","7","8"))));
// For indexed array:
$graph->data->arrayIndexed (array (array ("T1","1","2","3","4"),
                                   array ("T2","5","6","7","8")));
// For associated array:
$graph->data->arrayAssociative (array (array ("t1"=>"11","t2"=>"12","t3"=>"13"),
                                       array ("t1"=>"21","t2"=>"22","t3"=>"23"),
                                       array ("t1"=>"31","t2"=>"32","t3"=>"33")));

$graph->drawImage();
The styles
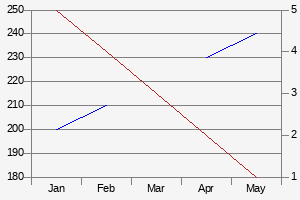
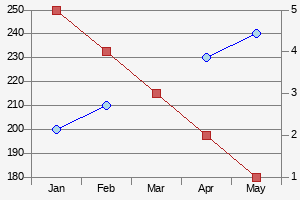
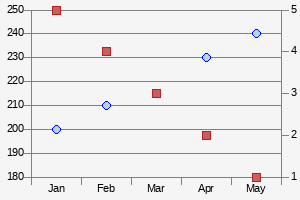
The series can be drawn by different styles : line, linePoints, points.
$graph = new Domframework\Graph ();
$graph->data->csv ("\"\",Jan,Feb,Mar,Apr,May\n".
                 "Prod,200,210,NO,230,240\n".
                 "Return,5,4,3,2,1")
            ->titlesOnFirstLine (true)
            ->titlesOnFirstColumn (true)
            ->horizontalData (true);
$graph->series->serie ("Return")->axisYsecondary(true);
$graph->drawImage ();
$graph = new Domframework\Graph ();
$graph->data->csv ("\"\",Jan,Feb,Mar,Apr,May\n".
"Prod,200,210,NO,230,240\n".
"Return,5,4,3,2,1")
->titlesOnFirstLine (true)
->titlesOnFirstColumn (true)
->horizontalData (true);
$graph->series->serie ("Return")->axisYsecondary(true);
$graph->style ("linePoints");
$graph->drawImage ();$graph = new Domframework\Graph ();
$graph->data->csv ("\"\",Jan,Feb,Mar,Apr,May\n".
"Prod,200,210,NO,230,240\n".
"Return,5,4,3,2,1")
->titlesOnFirstLine (true)
->titlesOnFirstColumn (true)
->horizontalData (true);
$graph->series->serie ("Return")->axisYsecondary(true);
$graph->style ("points");
$graph->drawImage ();The integrated objects
The graph object carry some objects specialized in functions:
- The graph object manage all the other ones. It allow to define the default style, the height and width of the drawn graph, the title position
$graph->style ("linePoints") ->width (300) ->height (200); - The data object: manage the input of the data (from array, CSV, JSON). Allow to manage if there is a title on first line or column with autodetection. It also permit to say if the data are stored horizontally or vertically
- The title object: manage the title of the graph, with font, size, color and text.
$graph->title->text ("The SUPER Title")
             ->color ("orange")
             ->fontsize (10)
             ->fontfile ("/usr/share/fonts/truetype/ttf-bitstream-vera/VeraBd.ttf");
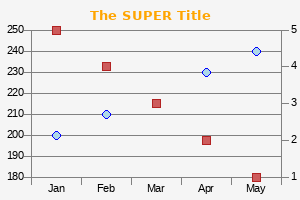
Example :
$graph = new Domframework\Graph ();
$graph->title->text ("The SUPER Title")
           ->color ("orange")
           ->fontsize (10)
           ->fontfile ("/usr/share/fonts/truetype/ttf-bitstream-vera/VeraBd.ttf");
$graph->data->csv ("\"\",Jan,Feb,Mar,Apr,May\n".
                 "Prod,200,210,NO,230,240\n".
                 "Return,5,4,3,2,1")
            ->titlesOnFirstLine (true)
            ->titlesOnFirstColumn (true)
            ->horizontalData (true);
$graph->series->serie ("Return")->axisYsecondary(true);
$graph->style ("points");
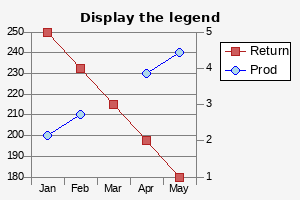
$graph->drawImage ();- The legend object: manage the display of a legend, with samples, series names, background-color, font and font size.
$graph->legend->show (true);
Example :
$graph = new Domframework\Graph ();
$graph->title->text ("Display the legend")
           ->fontsize (10)
           ->fontfile ("/usr/share/fonts/truetype/ttf-bitstream-vera/VeraBd.ttf");
$graph->data->csv ("\"\",Jan,Feb,Mar,Apr,May\n".
                 "Prod,200,210,NO,230,240\n".
                 "Return,5,4,3,2,1")
            ->titlesOnFirstLine (true)
            ->titlesOnFirstColumn (true)
            ->horizontalData (true);
$graph->series->serie ("Return")->axisYsecondary(true);
$graph->style ("linePoints");
$graph->legend->show (true);
$graph->drawImage ();- The series object manage the data series. It is an abstraction class.
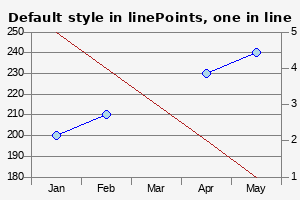
- The serie object, provided by the $graph->series->serie ("NAME"), allow to manage the serie. The serie can be drawn on the secondary axis, can have a maximum or minimum value, can have a style different of the general one defined in graph object. It allow to define if the provided data are numerical or labeled
$graph->series->serie ("Return")->style ("line")
                                ->axisYsecondary(true);
Example :
$graph = new Domframework\Graph ();
$graph->style ("linePoints");
$graph->title->text ("Default style in linePoints, one in line")
           ->fontsize (10)
           ->fontfile ("/usr/share/fonts/truetype/ttf-bitstream-vera/VeraBd.ttf");
$graph->data->csv ("\"\",Jan,Feb,Mar,Apr,May\n".
                 "Prod,200,210,NO,230,240\n".
                 "Return,5,4,3,2,1")
            ->titlesOnFirstLine (true)
            ->titlesOnFirstColumn (true)
            ->horizontalData (true);
$graph->series->serie ("Return")->axisYsecondary(true)->style("line");
$graph->drawImage ();- The axis object allow to manage the colors, fonts (type and size). The objects defined can be used by $graph->axisX, $graph->axisY1 or $graph->axisY2
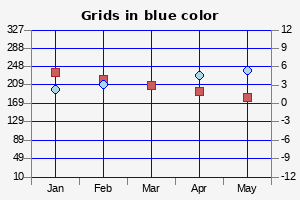
$graph->axisY1->min (10)->max (300)->numerical (true);
$graph->axisY2->min (-10)->max (10)->numerical (true);
$graph->axisY1->gridColor ("blue");
$graph->axisY2->gridColor ("blue");
$graph->axisX->gridColor ("blue");
Example :
$graph = new Domframework\Graph ();
$graph->title->text ("Grids in blue color")
           ->fontsize (10)
           ->fontfile ("/usr/share/fonts/truetype/ttf-bitstream-vera/VeraBd.ttf");
$graph->data->csv ("\"\",Jan,Feb,Mar,Apr,May\n".
                 "Prod,200,210,NO,230,240\n".
                 "Return,5,4,3,2,1")
            ->titlesOnFirstLine (true)
            ->titlesOnFirstColumn (true)
            ->horizontalData (true);
$graph->series->serie ("Return")->axisYsecondary(true);
$graph->style ("points");
$graph->axisY1->min (10)->max (300)->numerical (true);
$graph->axisY2->min (-10)->max (10)->numerical (true);
$graph->axisY1->gridColor ("blue");
$graph->axisY2->gridColor ("blue");
$graph->axisX->gridColor ("blue");
$graph->drawImage ();
The class definition
Class Domframework\Graph
Namespace Domframework
Description
/**
 This class allow to generate an image which is a graphic. A graphic takes
 an array of values and draw the lines/histo... like a spreadsheet
 graph methods are :
   ->height ($height) or ->width ($width) The heigh/width of the graph
Properties
public $axisX;
/**
 The X axis object
public $axisY1;
/**
 The main Y axis object
public $axisY2;
/**
 The optional secondary Y axis object
public $data;
/**
 The data object
public $legend;
/**
 The legend object
public $series;
/**
 The series object
public $title;
/**
 The graph title object
Methods
public function __construct ()
/**
 Constructor : create the objects
public function bgcolor ( $bgcolor=null)
/**
 Set the background-color of the graph if the parameter is provided.
 Get the background-color of the graph if the parameter is not provided
 @param string|null $bgcolor The background-color of the graph
public function drawBase64 ()
/**
 Return the image coded in base64
 @return string The base64 string
public function drawImage ()
/**
 Draw the graph to the screen with the previous defined parameters
public function height ( $height=null)
/**
 Set the height of the graph if the parameter is provided.
 Get the height of the graph if the parameter is not provided
 @param integer|null $height The height of the graph
public function style ( $style=null)
/**
 Set the default style of the graph if the parameter is provided.
 Get the default style of the graph if the parameter is not provided
 @param string|null $style The style of the graph
public function titlePosition ( $titlePosition=null)
/**
 Set the title position of the graph if the parameter is provided.
 Get the title position of the graph if the parameter is not provided
 @param string|null $titlePosition The title position of the graph
public function width ( $width=null)
/**
 Set the width of the graph if the parameter is provided.
 Get the width of the graph if the parameter is not provided
 @param integer|null $width The width of the graph
